Quality.


Features of the SBB statistics portal
Context menu
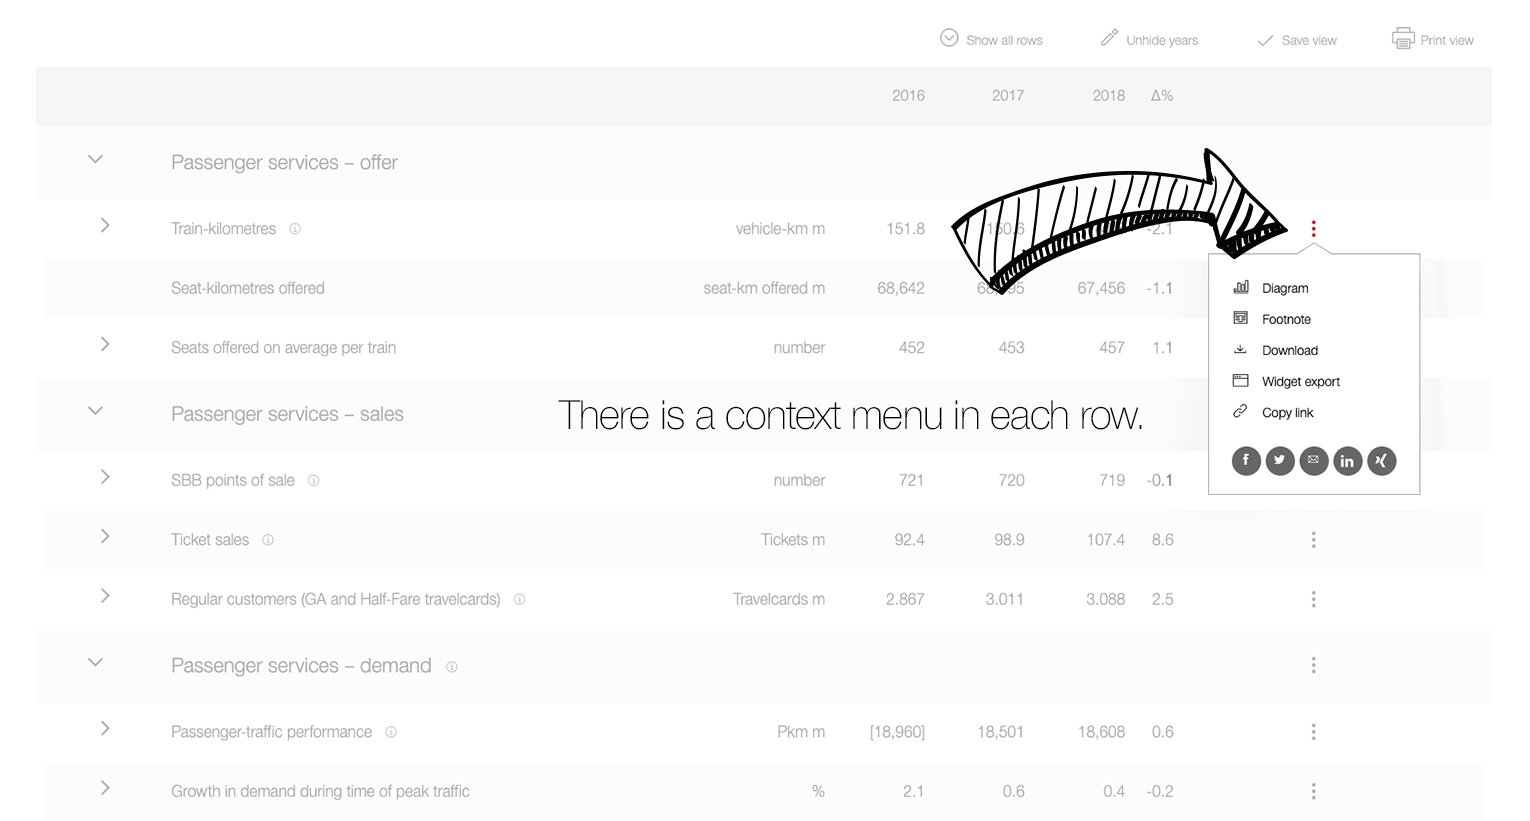
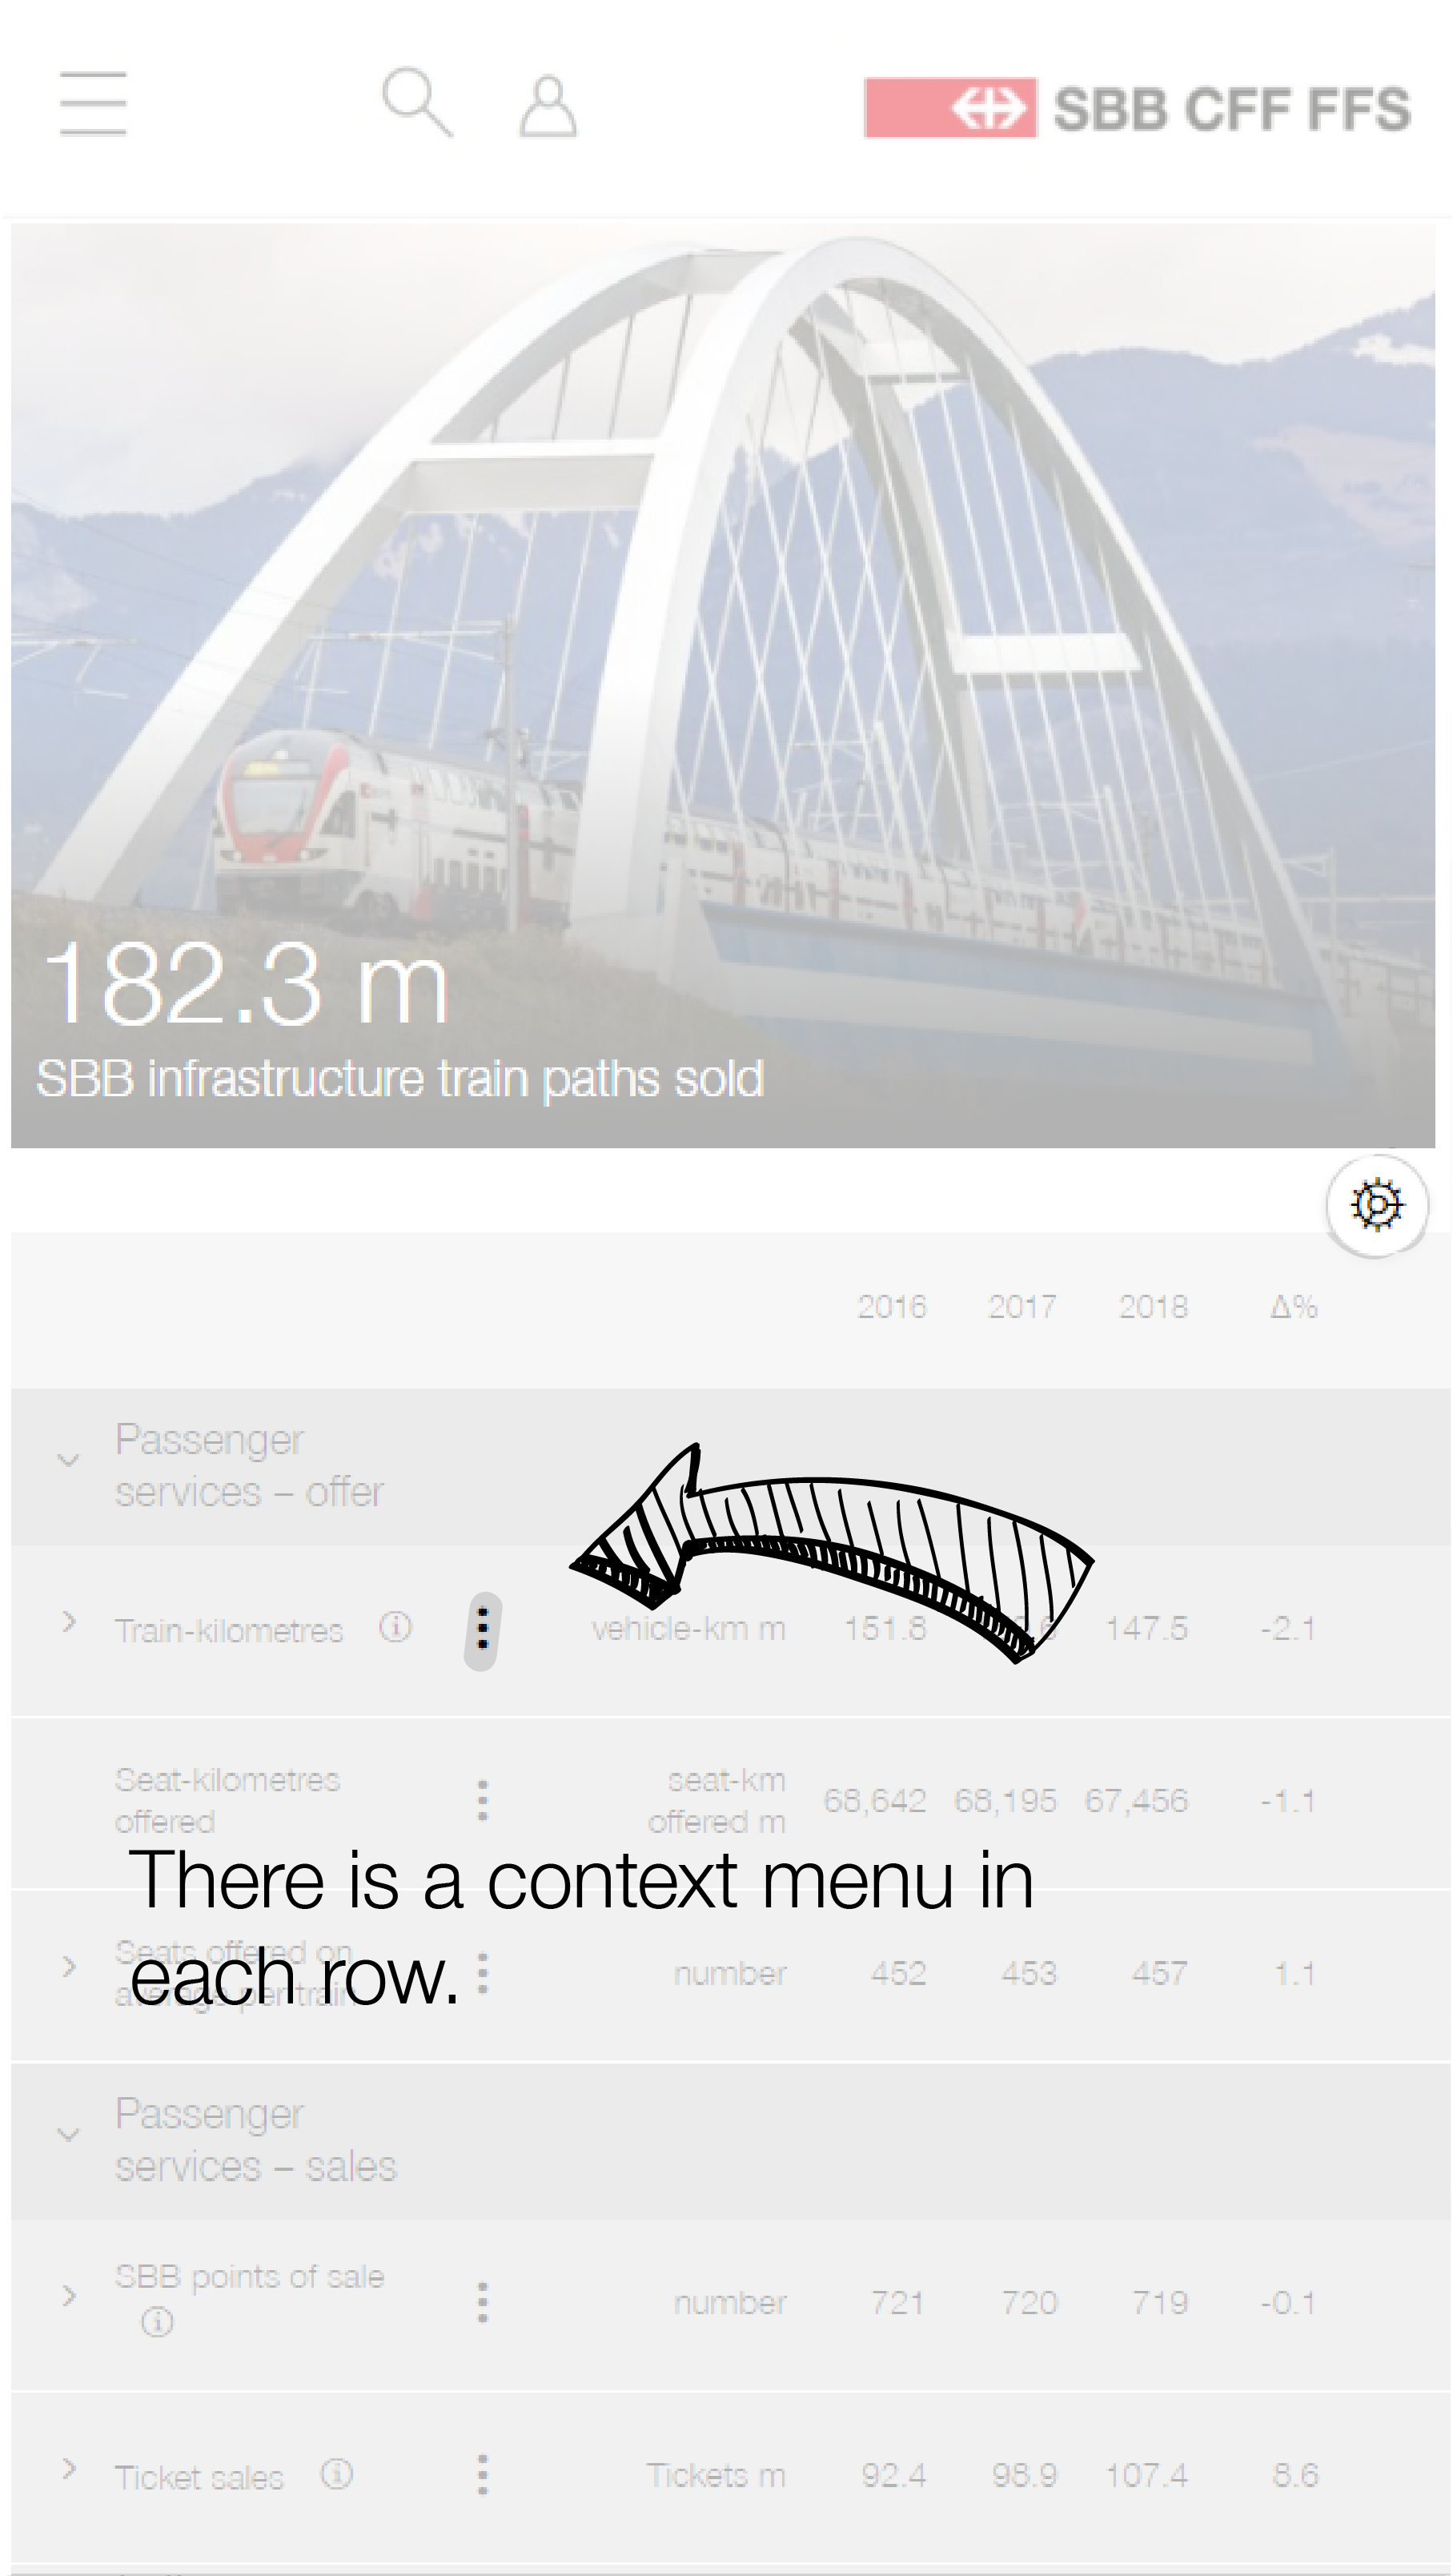
Click on the three dots to display all features in a context menu.
«i» icon
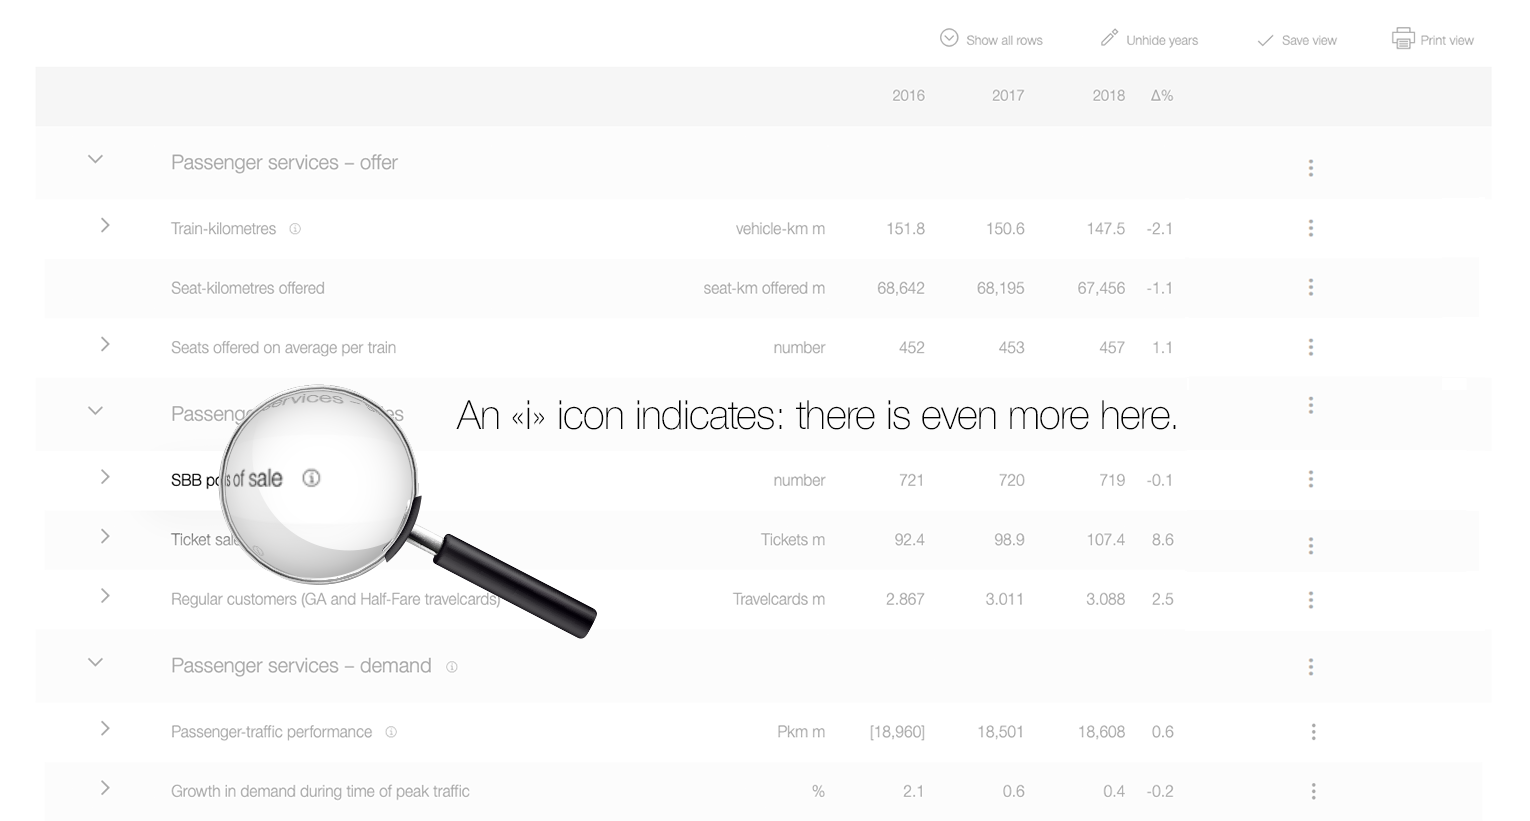
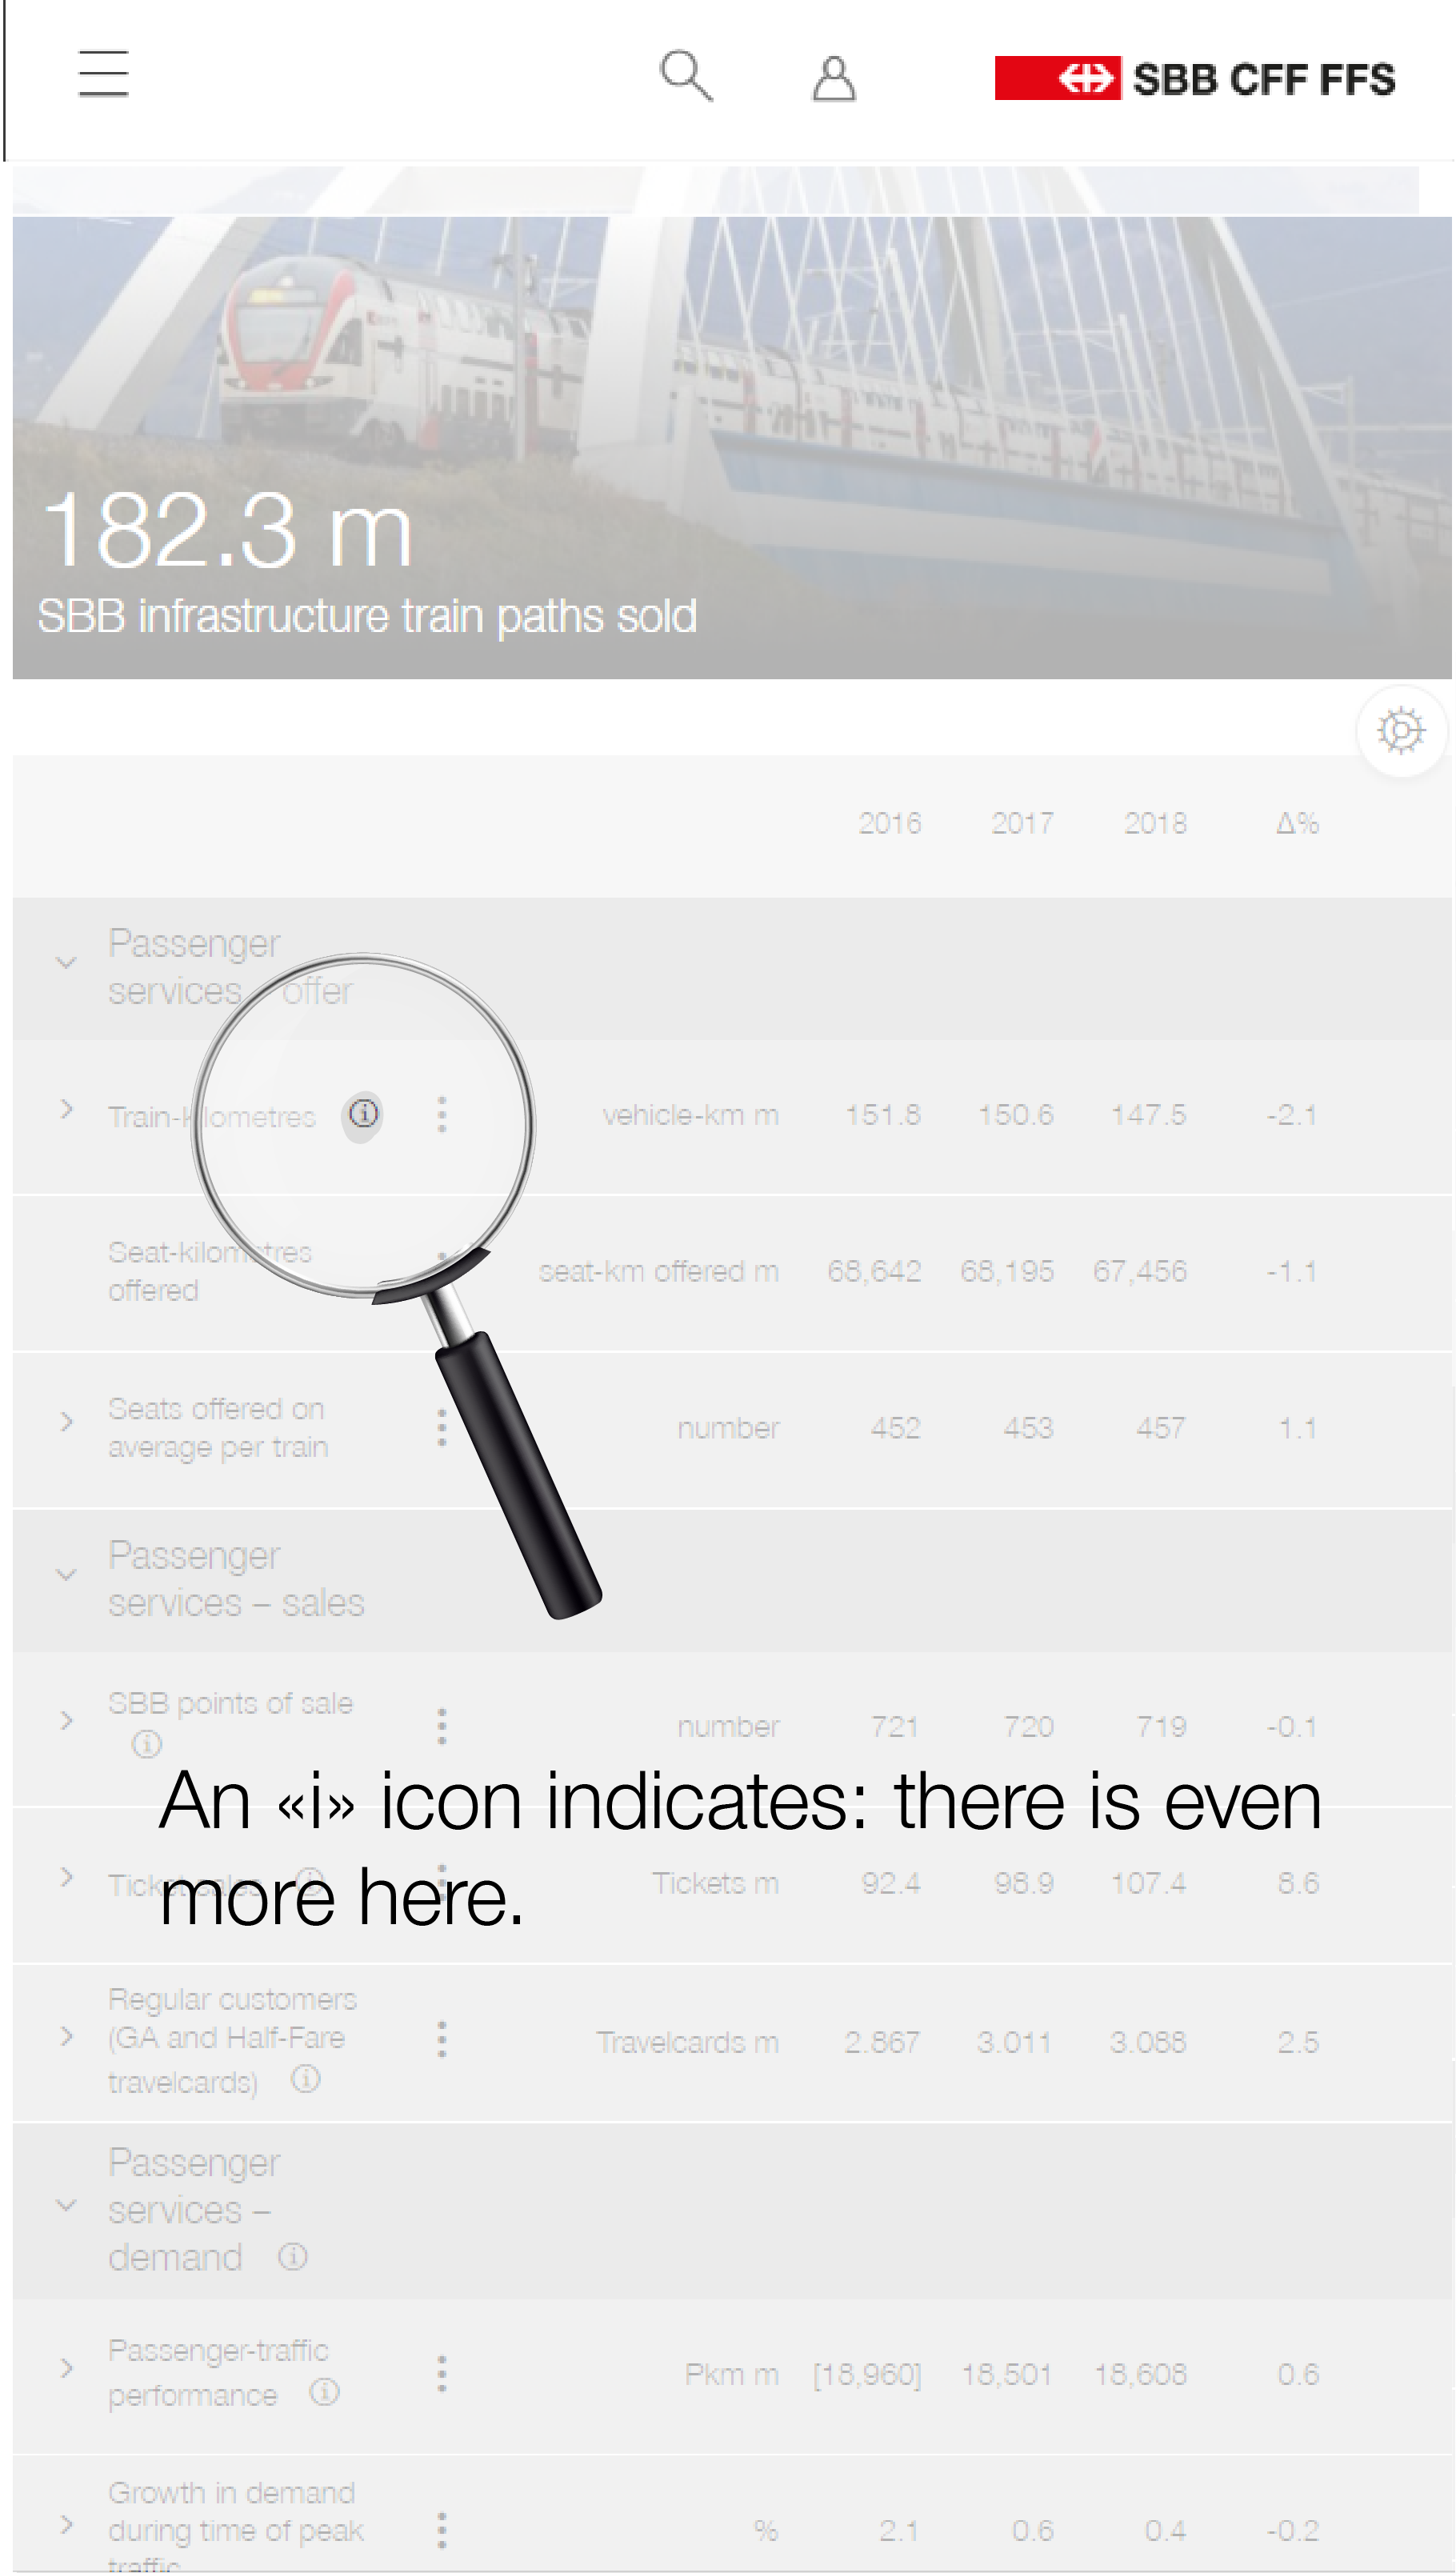
An «i» icon indicates the existence of a footnote or a file to download. These options do not exist in every row.
Widget
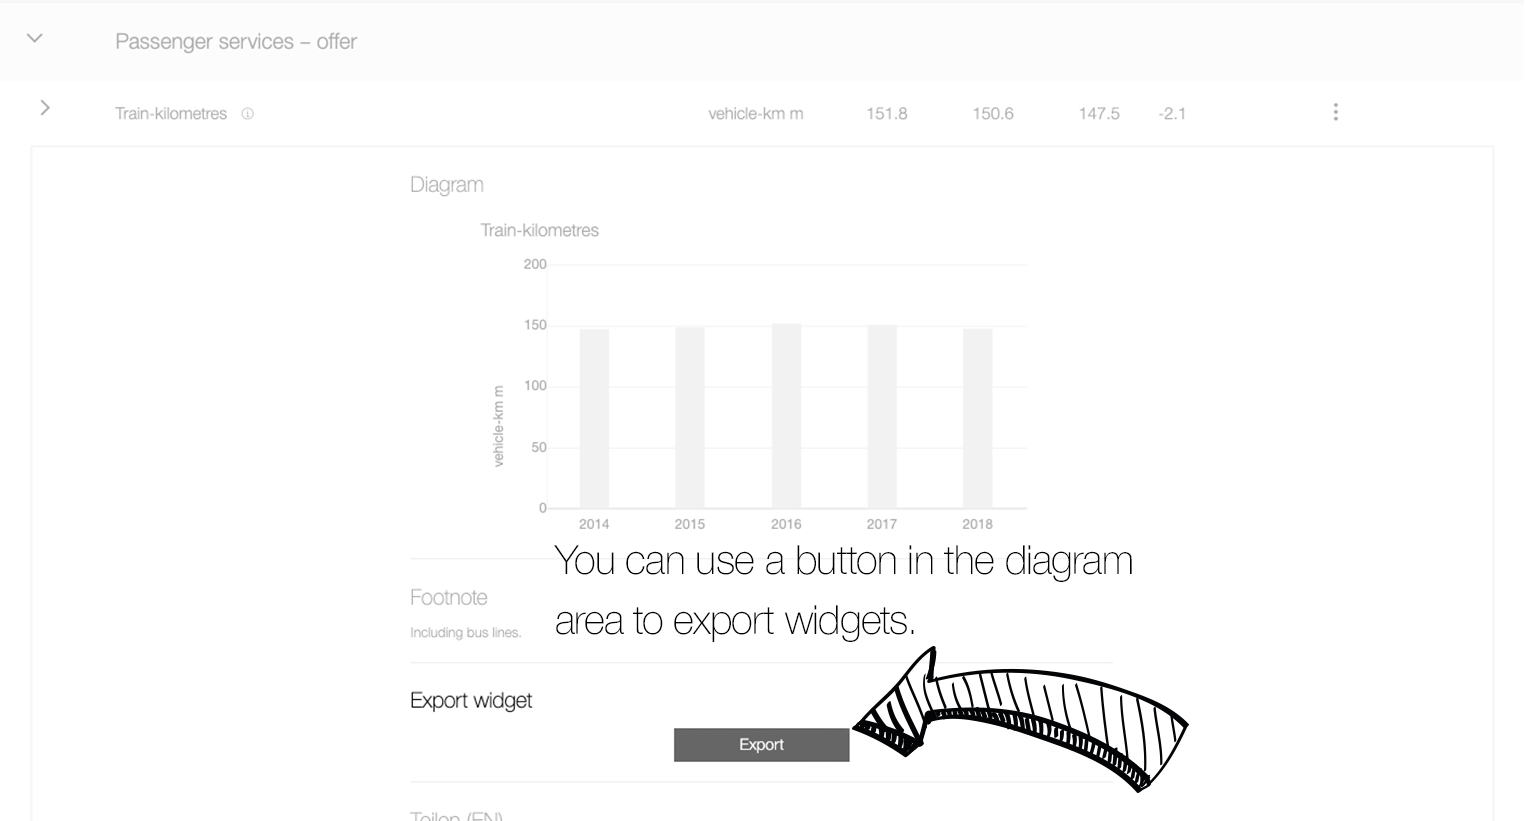
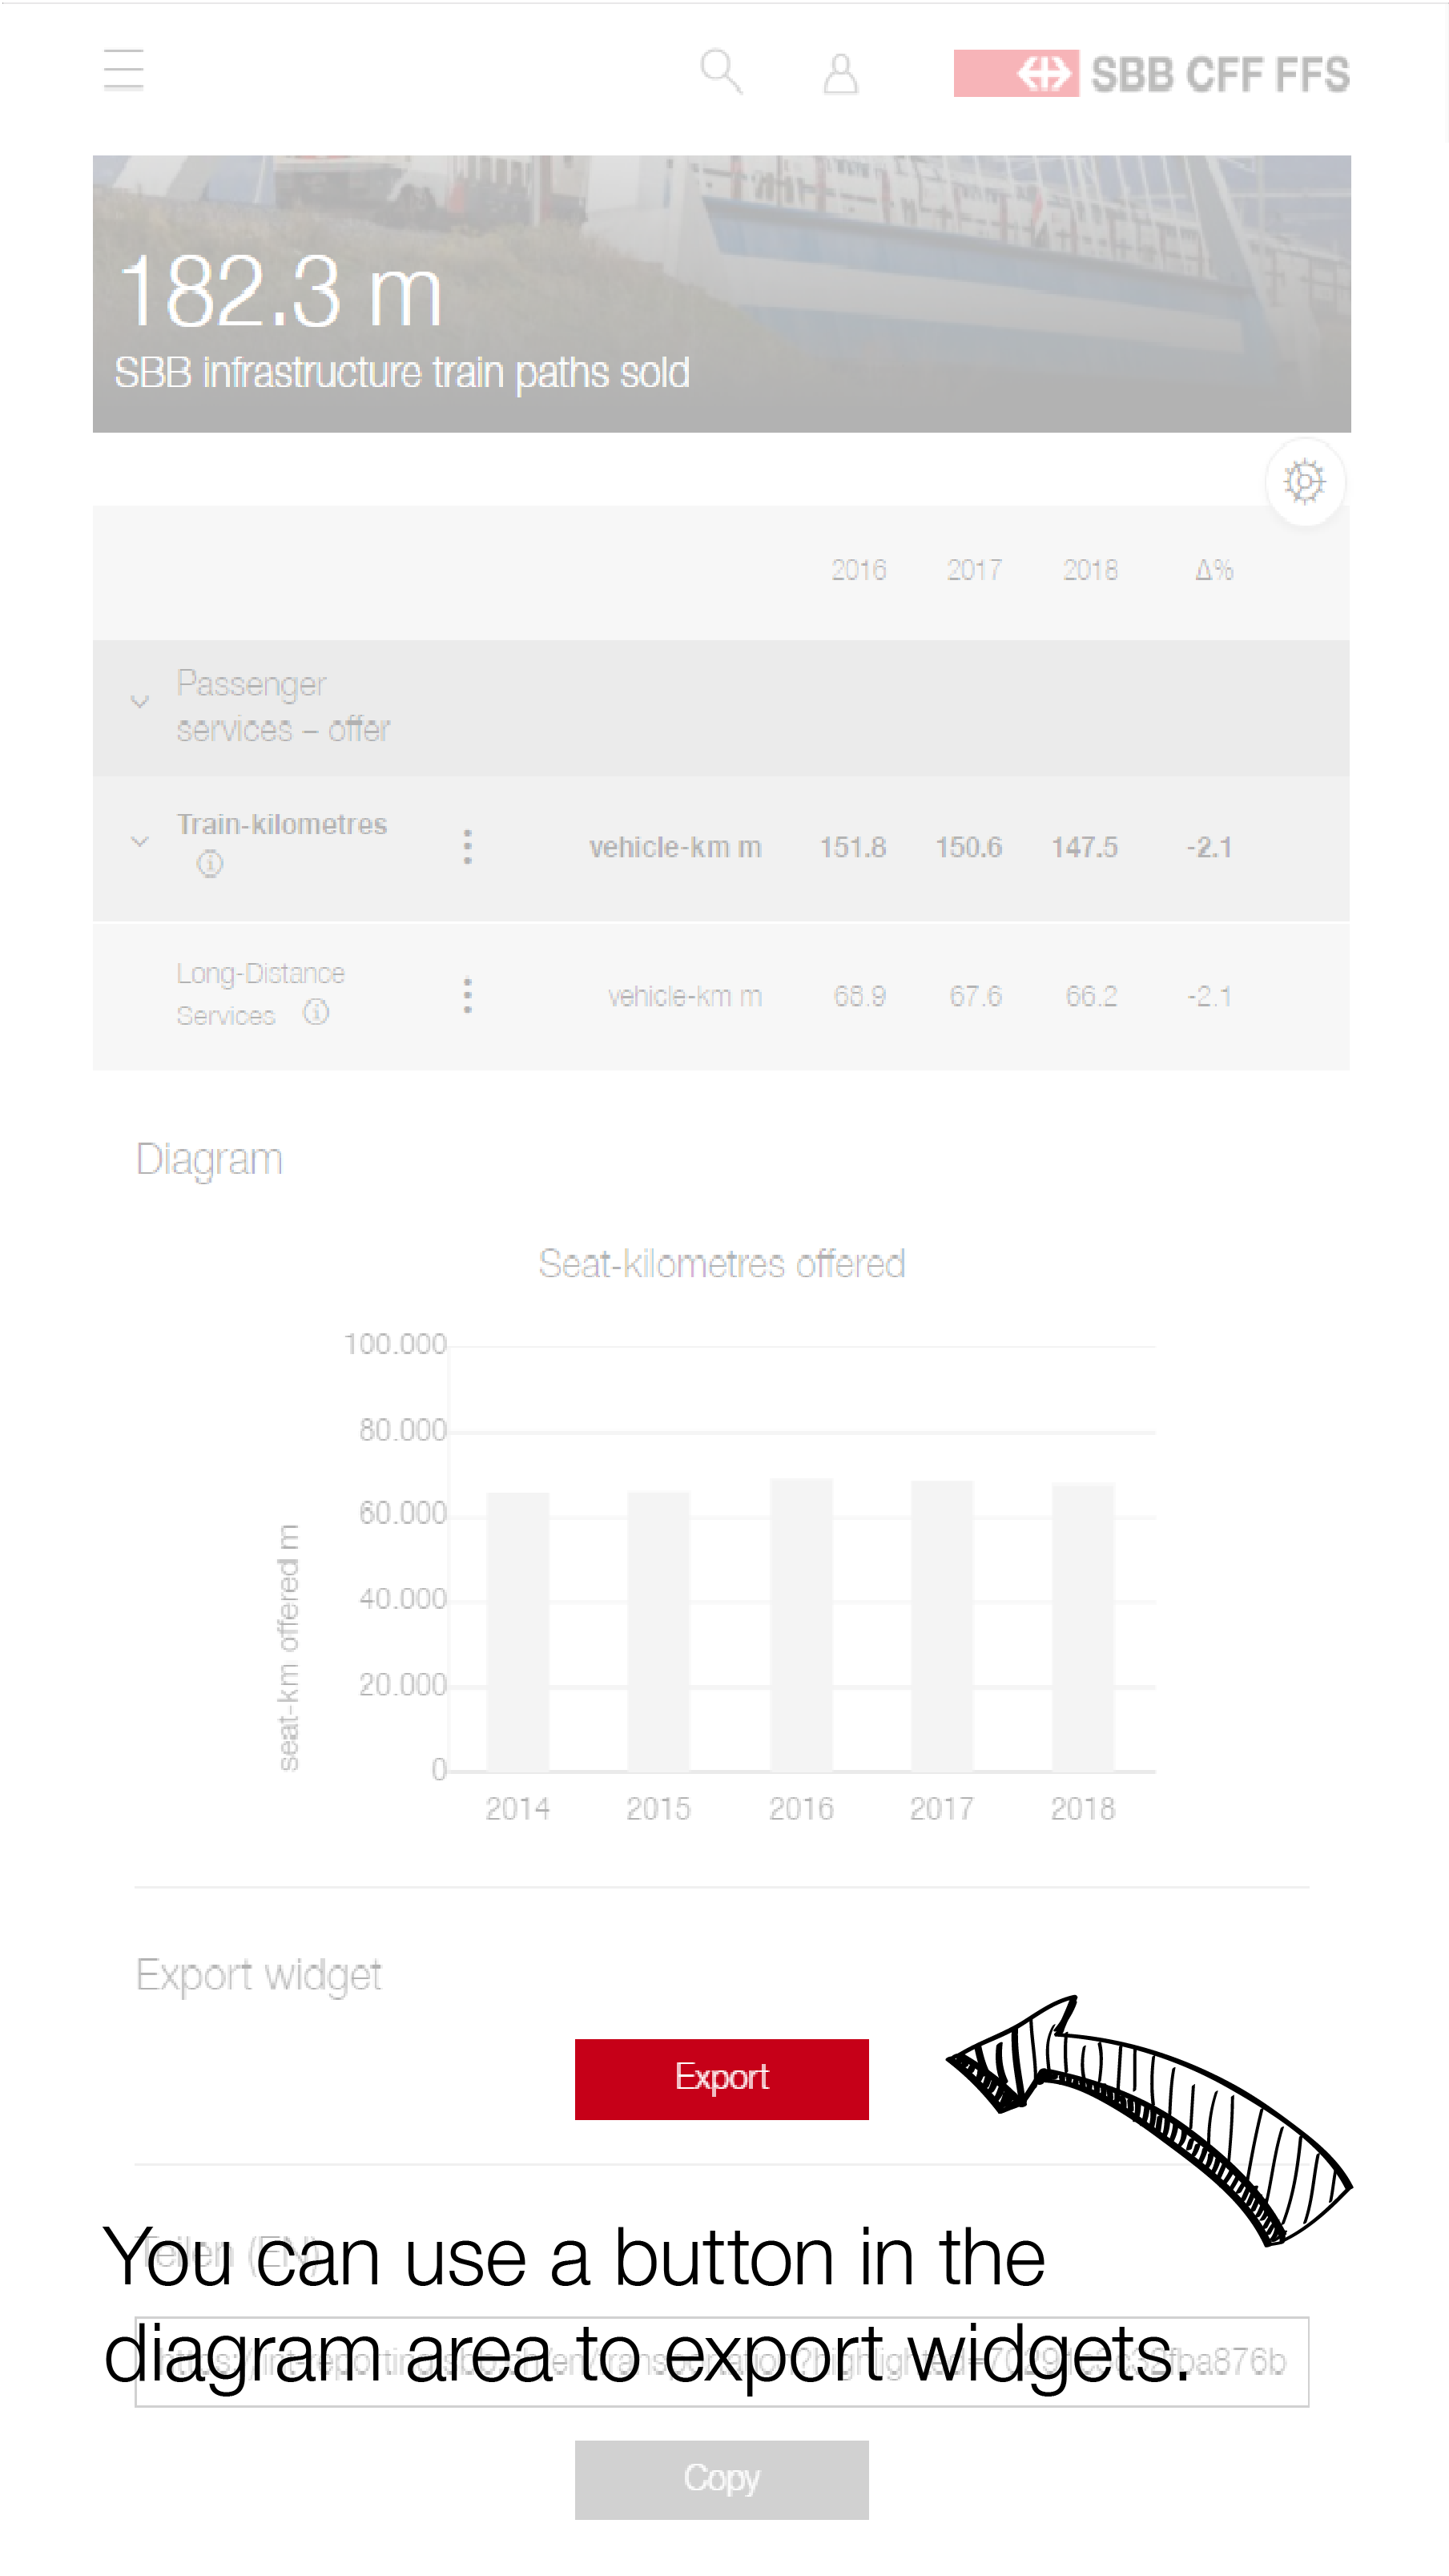
You can use a widget to embed content from the SBB statistics portal directly in your website, including automatic updates.
Widget generator
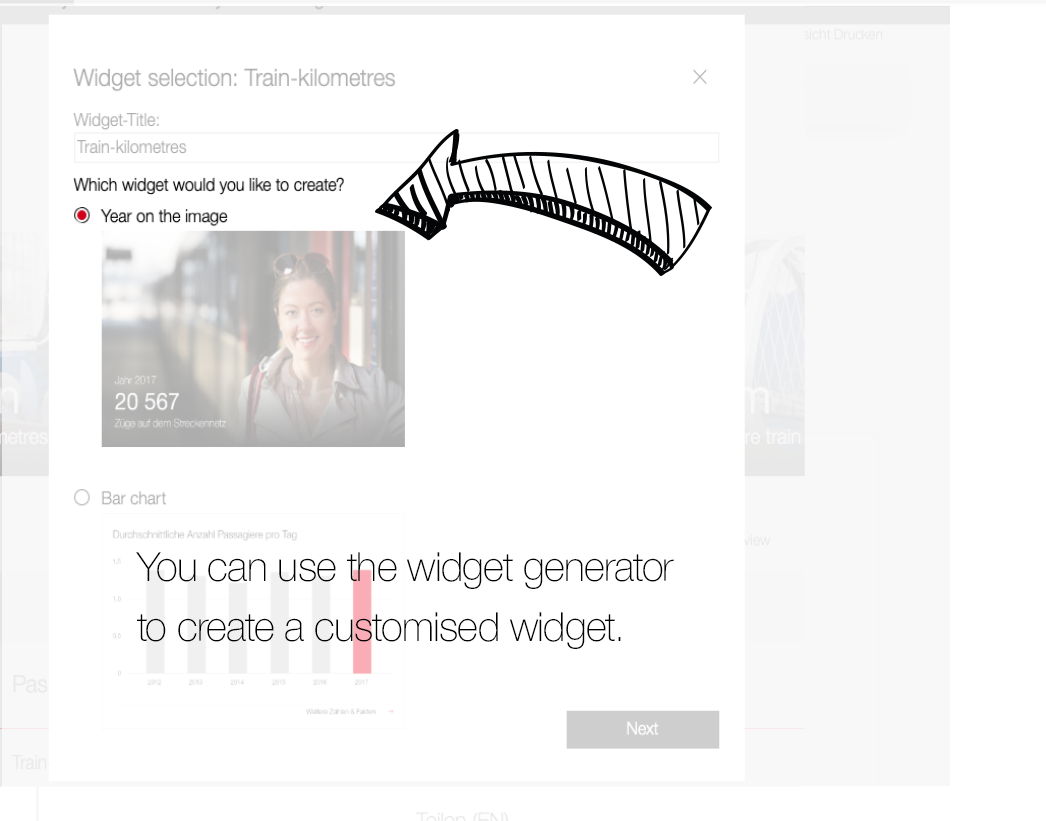
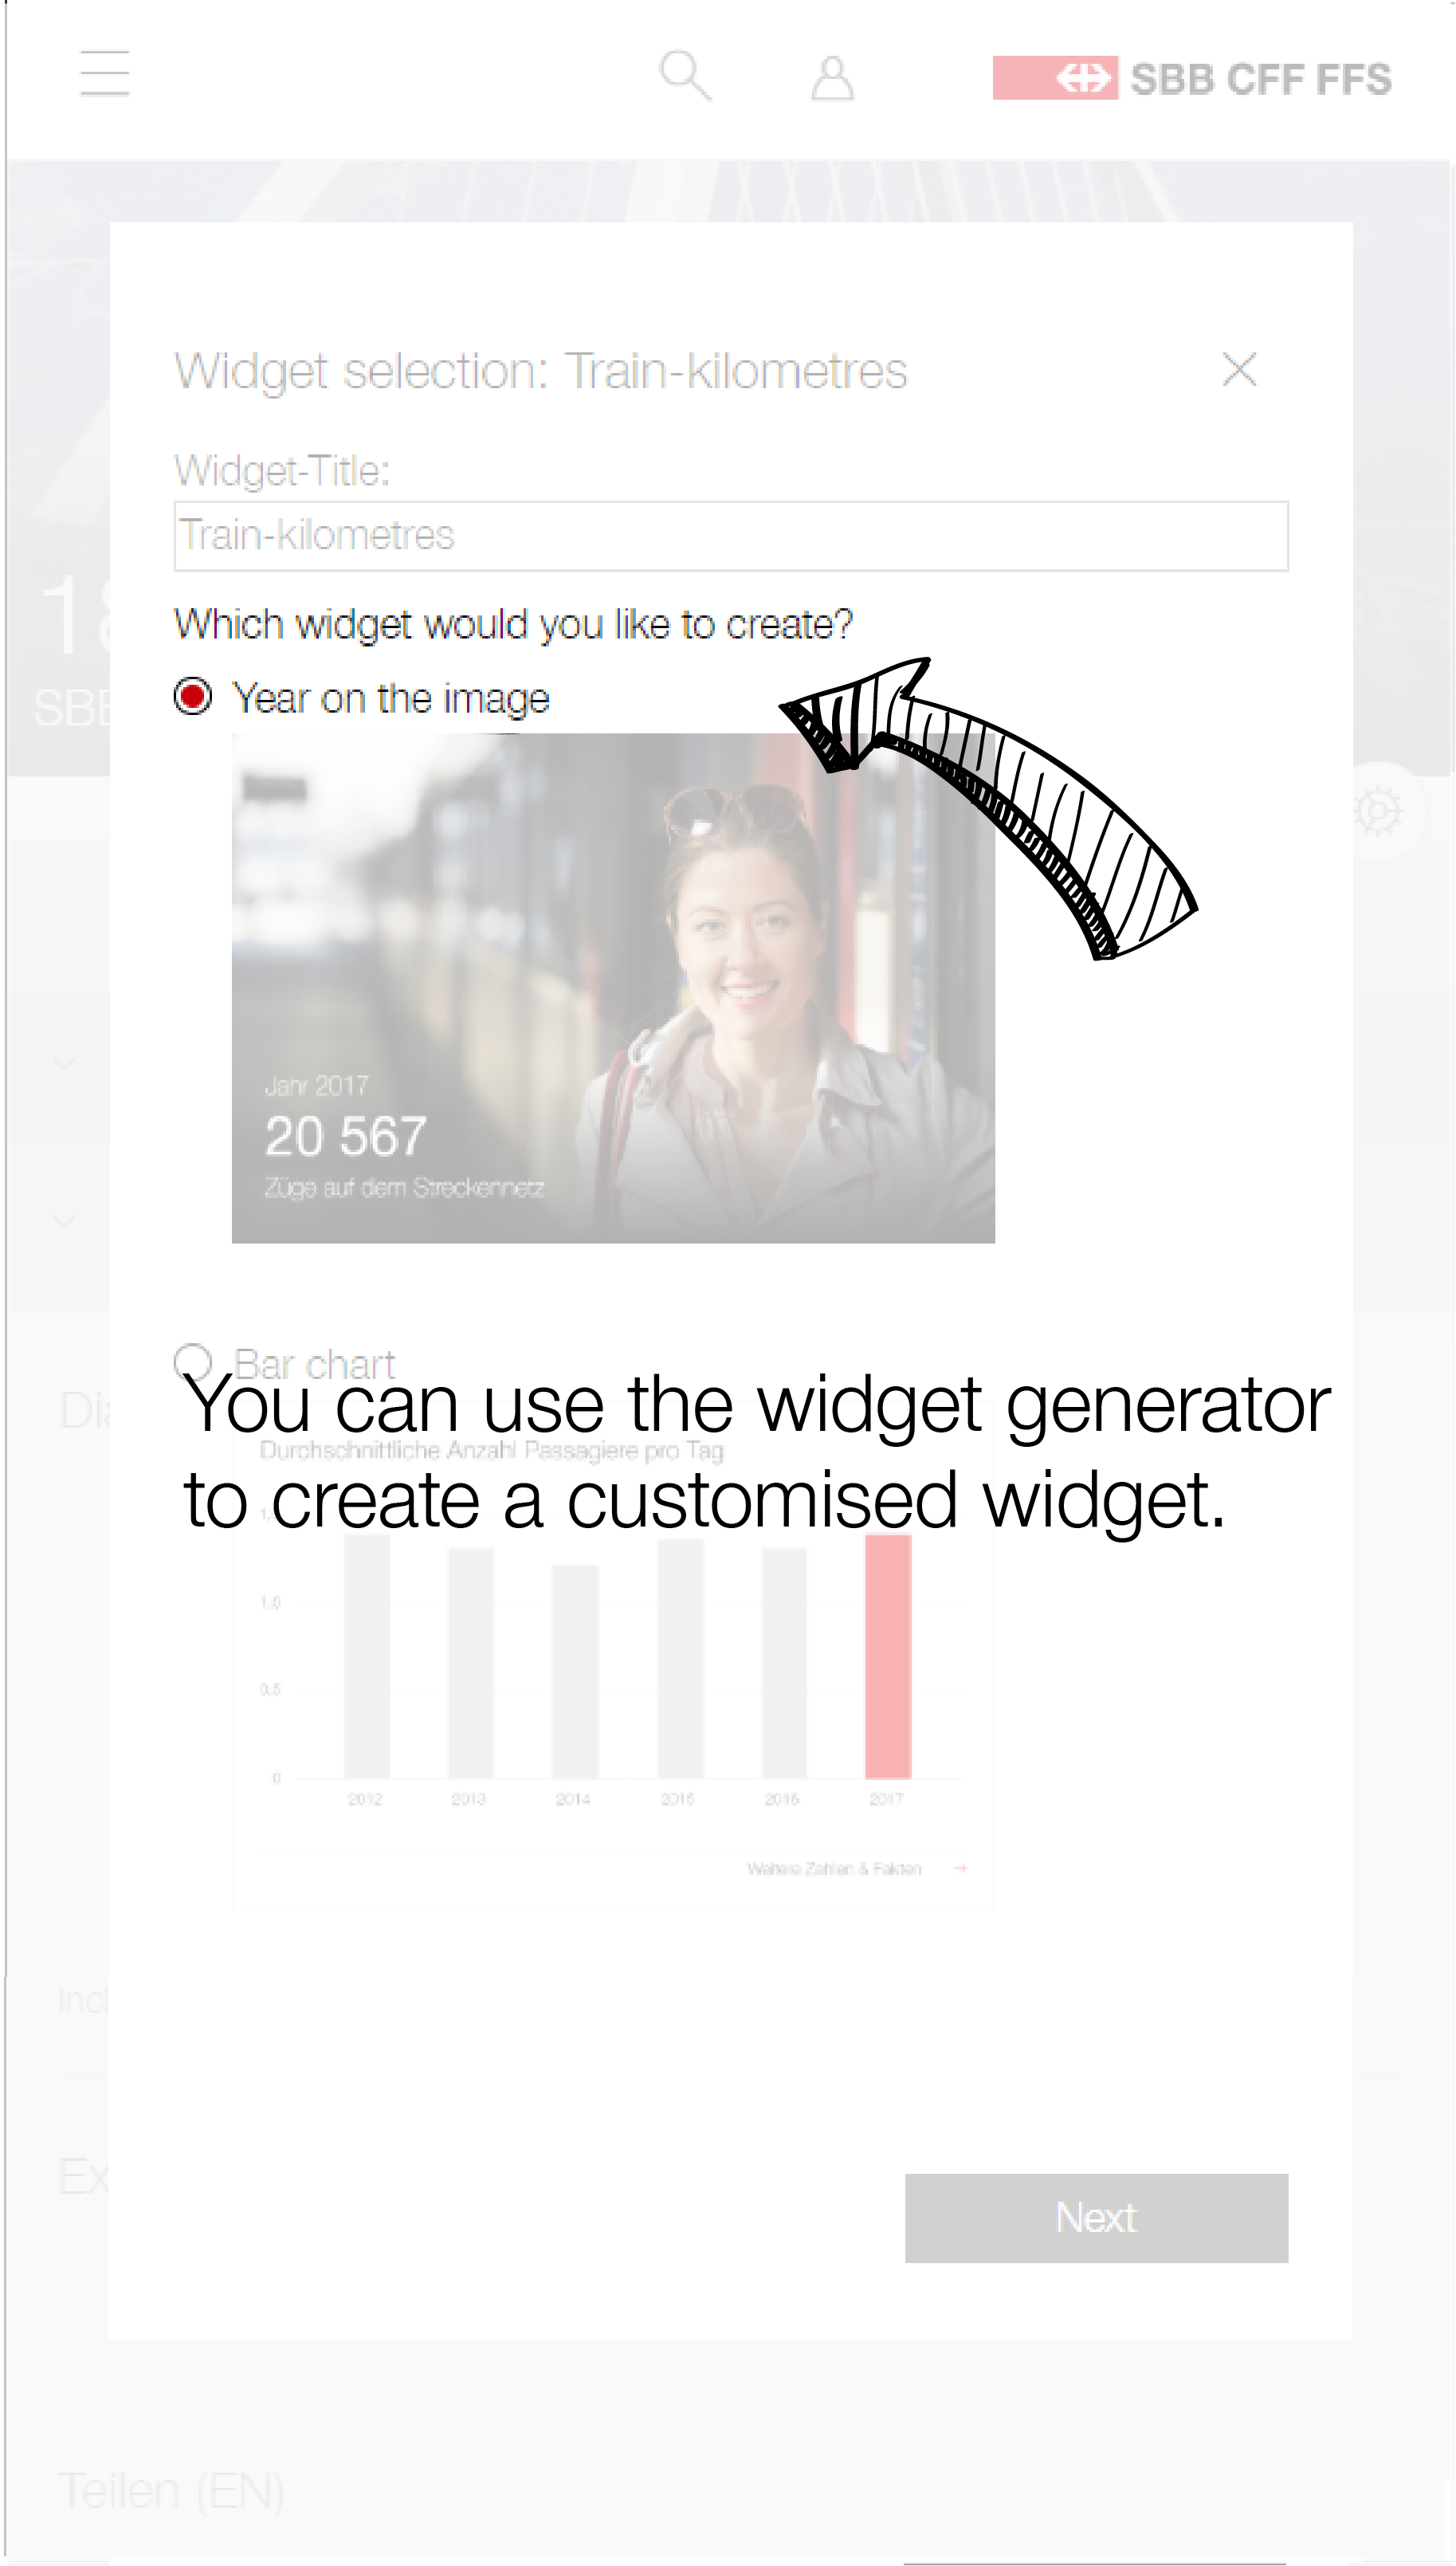
Your selection creates an HTML code. Embed this code in your website.
- Copy link
- Copy link


Features of the SBB statistics portal
Context menu
Click on the three dots to display all features in a context menu.
«i» icon
An «i» icon indicates the existence of a footnote or a file to download. These options do not exist in every row.
Widget
You can use a widget to embed content from the SBB statistics portal directly in your website, including automatic updates.
Widget generator
Your selection creates an HTML code. Embed this code in your website.
- Copy link
Features of the SBB statistics portal
Context menu
Click on the three dots to display all features in a context menu.
«i» icon
An «i» icon indicates the existence of a footnote or a file to download. These options do not exist in every row.
Widget
You can use a widget to embed content from the SBB statistics portal directly in your website, including automatic updates.
Widget generator
Your selection creates an HTML code. Embed this code in your website.